Marketing & Analytics  ·  Prepared by FutureInSites  ·  February 2026

TESLA
Sentiment at Scale

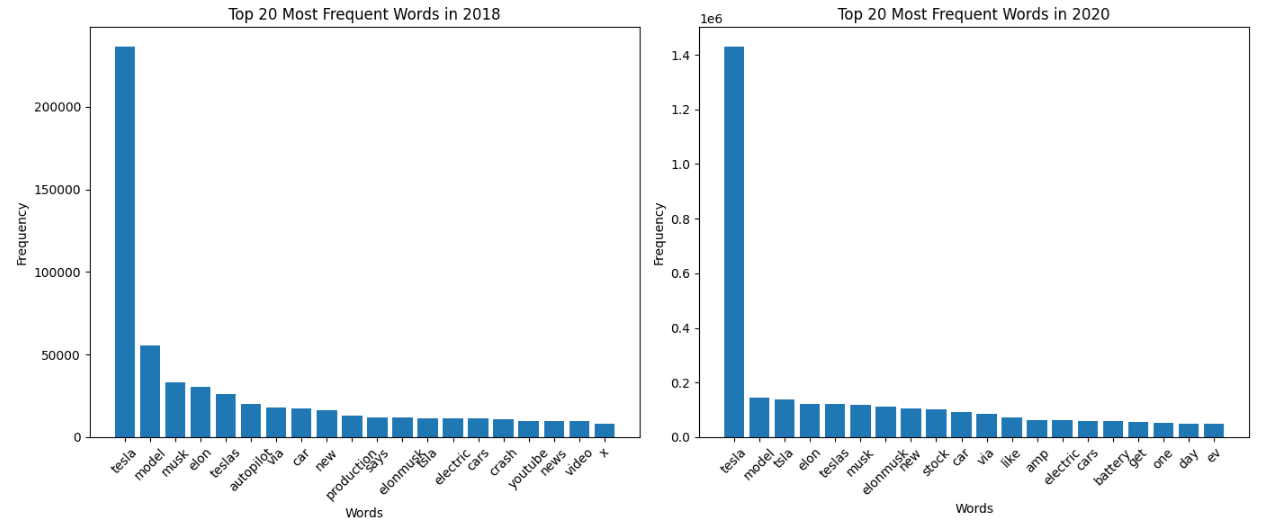
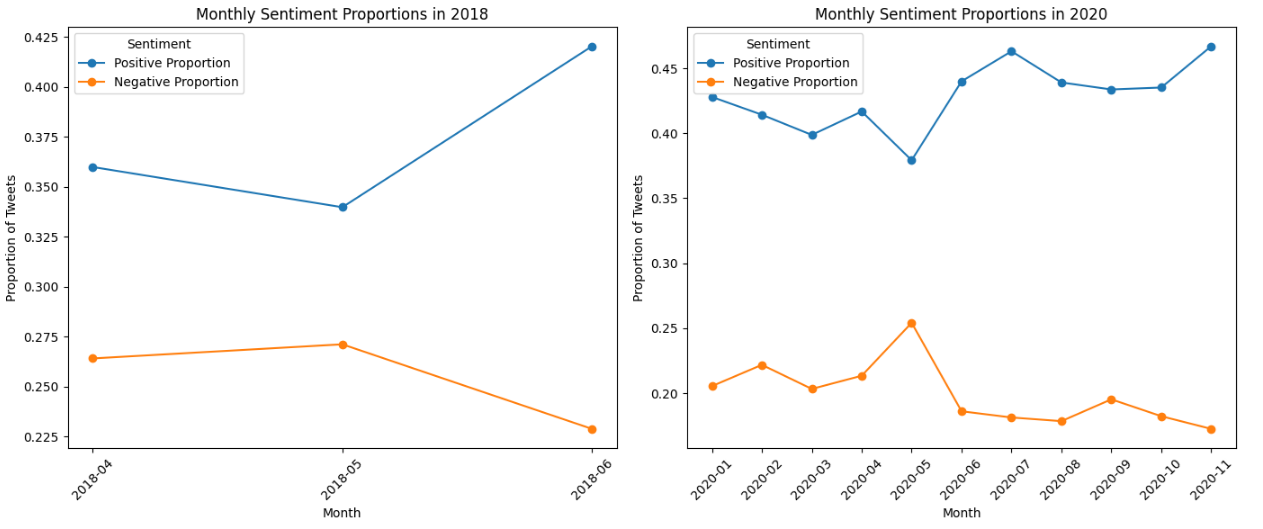
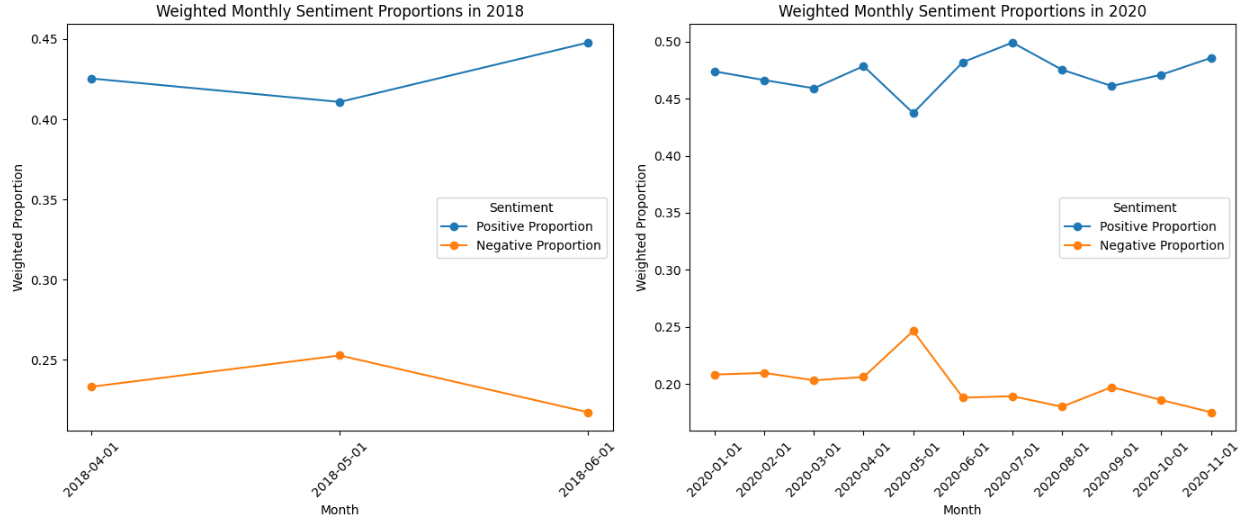
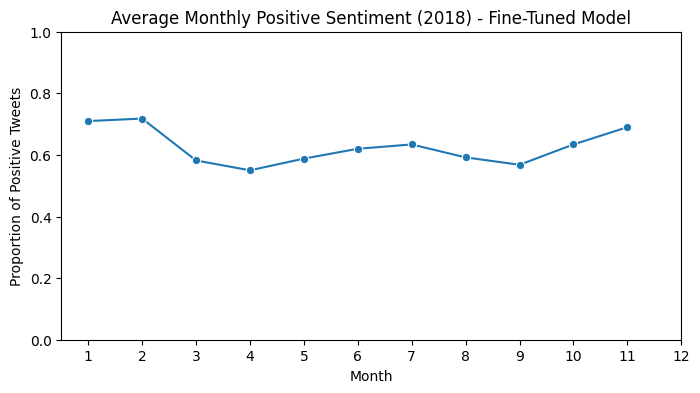
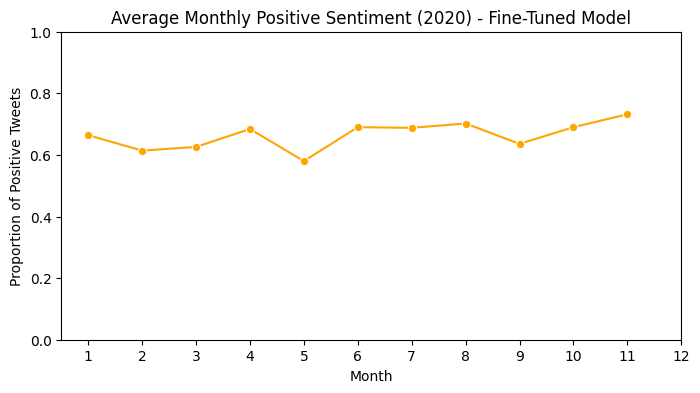
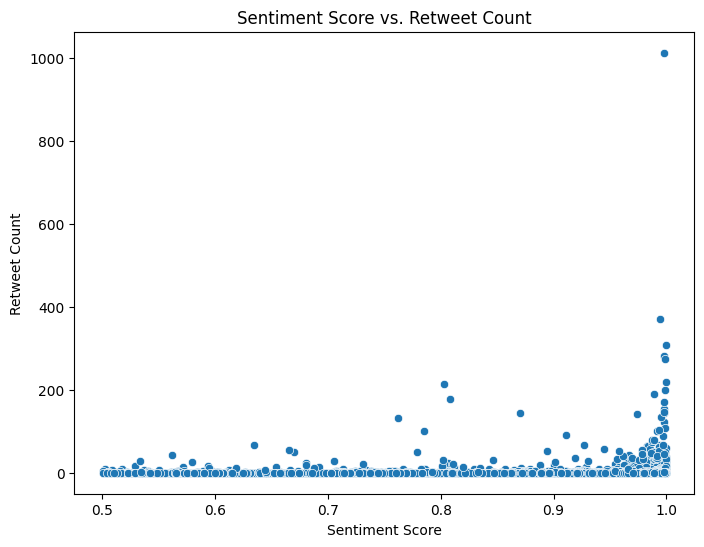
What 2.4 million tweets reveal about Tesla's brand on Twitter in 2018 and 2020, analyzed with VADER, a default BERT model, and a BERT model fine-tuned on Sentiment140.

Word cloud of Tesla-related tweets, dominated by 'tesla', 'model', 'elon musk', and emerging themes like 'electric' and 'stock'
"Across 2.4 million Tesla tweets, the brand maintained roughly a 2-to-1 ratio of positive to negative sentiment. Viral content skewed even more positive. The story of Tesla on Twitter is less about controversy than about an enthusiastic supporter base that consistently outvoiced its critics."
FutureInSites Analysis  ·  February 2026

A 2.4M-tweet view of Tesla's brand

Social media offers a continuous, unfiltered signal of public sentiment that traditional surveys and focus groups cannot match in scale or timeliness. This study mines ~2.4 million Tesla tweets from 2018 and 2020 using three sentiment models in sequence: VADER (a rule-based lexicon tuned for social media), a default BERT classifier (originally trained on movie reviews), and a fine-tuned BERT model trained further on the Sentiment140 dataset of 1.6 million labeled tweets.

The core finding is consistent across methods: Tesla maintained a net positive public image in both years studied, with predictable troughs around controversies (Model 3 production in 2018, the May 2020 pandemic factory shutdown) and recoveries tied to product milestones. Engagement-weighted analysis sharpens the picture: Tesla's most-amplified content skewed even more positive than the overall average.
~2.4M
Tweets
Analyzed
3
Sentiment Models
Compared
2:1
Positive to Negative
Ratio (VADER)
+50pp
Swing from Default
to Fine-Tuned BERT
01

Tesla's Twitter base is loud and positive

Across both years, positive tweets outnumbered negative tweets roughly 2-to-1, and engagement-weighted content skewed even more positive. Tesla's loudest voices are also its most supportive ones.

02

Sentiment recovers fast after adverse events

Negative spikes around the 2018 production crisis and the May 2020 pandemic shutdown reversed within a single month. The recovery pattern points to a loyal base that compensates for short-term criticism.

03

Model choice can flip a brand's diagnosis

Default BERT trained on movie reviews labeled 75% of Tesla tweets negative. The same BERT architecture, fine-tuned on tweet language, called 60-70% positive. Domain match matters more than model size.

Five steps from raw tweets to comparable sentiment

Before any model can read a tweet, the data has to be cleaned, structured, and prepared in ways that let one method's output be compared against another's. The workflow below is the same one used in production social-listening pipelines, executed end-to-end in Python.

Step 01

Data preprocessing

Strip URLs, @-mentions, hashtags, and emoji. Lowercase all text. Remove stopwords (the, a, is). Split by year so 2018 and 2020 can be compared directly. Without this step, hyperlinks and filler words would dominate every downstream chart.

Step 02

Exploratory frequency analysis

Surface dominant themes through top-20 word counts, top-20 bigrams (two-word phrases), top hashtags, and word clouds. Bigrams in particular capture context that single-word counts miss: "model 3," "electric vehicle," "full self driving" are concepts, not coincidences.

Step 03

VADER sentiment scoring

Rule-based lexicon designed for social media. Each tweet gets a compound score from -1 to +1, accounting for capitalization (ALL CAPS), punctuation (!!!), and emoji. Fast, transparent, and battle-tested on short informal text.

Step 04

Default BERT classification

Apply a pre-trained BERT model to a sampled subset of tweets. BERT reads whole sentences in context, catching negation and sarcasm that VADER misses. Output is a class label plus a confidence score from 0 to 1.

Step 05

Fine-tuned BERT on Sentiment140

Continue training the same BERT base on Sentiment140 (1.6M labeled tweets). The model architecture is unchanged; only the training data shifts from movie reviews to tweets. This is the closest match to the production task.

Step 06

Engagement-weighted re-scoring

Multiply each tweet's sentiment by a composite engagement score (retweets, favorites, replies, quotes). A tweet seen by 50,000 people now carries more weight than one seen by 5. This is how PR professionals already think about media impact.

Tools & Libraries Used
Python pandas NLTK vaderSentiment Hugging Face Transformers BERT (base-uncased) Sentiment140 matplotlib seaborn wordcloud Jupyter
Bar chart of the 20 most frequent words in Tesla tweets, 2018 vs 2020

Fig. 1: Top 20 most-frequent words in Tesla tweets, 2018 (left) vs 2020 (right). Note the shift from "production" and "crash" in 2018 toward "stock," "battery," and "ev" in 2020.

Bar chart of the top 20 two-word phrases in Tesla tweets, 2018 vs 2020

Fig. 2: Top 20 bigrams. Bigrams capture context single words cannot. "model 3," "full self driving," and "electric vehicle" emerge as concrete concepts in the conversation.

Word cloud of Tesla-related tweets in 2020, dominated by 'tesla' with 'nikola', 'stock', and 'electric' rising in prominence

Fig. 3: 2020 word cloud. The emergence of "nikola" (a 2020 EV competitor that went public via SPAC), "tesla stock," and "electric" signals that Tesla had moved from a manufacturing story toward a mainstream consumer and investor brand.

Bar chart of the top 10 hashtags in Tesla tweets, 2018 vs 2020. 2020 shifts toward sustainability hashtags.

Fig. 4: Top hashtags. The 2018 mix is product- and founder-centric (#Model3, #ElonMusk, #SpaceX). By 2020, sustainability hashtags (#EV, #Renewables, #ClimateChange) push into the top 10, signaling a broadened audience.

VADER sentiment over time, with and without engagement

VADER's compound score classifies each tweet as positive, neutral, or negative. Plotted month by month across both years, the unweighted view shows steady positive lean punctuated by predictable dips around real-world events. The engagement-weighted view, which gives extra weight to viral tweets, sharpens the picture: Tesla's most-amplified content skews even more positive than the average tweet.

Monthly proportions of positive vs negative Tesla tweets for 2018 (Apr-Jun) and 2020 (Jan-Nov)

Fig. 5: Unweighted monthly sentiment proportions. 2018 (left): positive rises from 36% in April to 42% by June across the Model 3 production crisis. 2020 (right): positive holds between 38% and 47%, with a clear May spike in negative sentiment (~25%) corresponding to the pandemic factory shutdown.

Monthly proportions of positive vs negative Tesla tweets weighted by engagement (retweets, favorites, replies, quotes)

Fig. 6: Engagement-weighted monthly sentiment. Weighted positive sits 4-7 percentage points higher than the unweighted baseline in most months, meaning Tesla's viral content tends to be more positive than its average tweet. The May 2020 negative spike persists, indicating the pandemic-shutdown controversy generated unusually high engagement.

What this means for brand monitoring: day-to-day tweet volume is not the right metric. Engagement-weighted sentiment is. A single high-engagement event (the pandemic shutdown, the "funding secured" tweet) can move the needle more than thousands of ordinary posts. The strongest brand-monitoring systems weight by reach, not count.

Three models, three answers, one architectural lesson

The most useful finding in this study is not about Tesla. It is about what happens when the same dataset is run through three different sentiment models. The headline numbers diverge so sharply that, to a non-technical reader, it would look like a methodology failure. It is not. Each method is making the right calculation for what it was trained on; the lesson is in matching the training data to the task.

Model Training Data Positive Rate on Tesla Tweets Strength Verdict
VADER Hand-curated social-media lexicon ~45% positive (with neutrals) Fast, transparent, handles emoji and ALL CAPS Good fit
BERT (default) Movie reviews (formal English) ~25% positive Reads full sentences in context Domain mismatch
BERT (fine-tuned) Sentiment140 (1.6M labeled tweets) ~60-70% positive Context + tweet-native language Best fit
Violin plot showing the distribution of BERT prediction confidence scores by sentiment label

Fig. 7: Default BERT confidence distribution. The model is highly confident in nearly every prediction, with scores concentrated near 1.0. The model is not confused. It is decisively applying movie-review logic to tweet text, which is the wrong tool calibrated to the wrong domain.

Monthly proportion of Tesla tweets classified as positive by the fine-tuned BERT model in 2018

Fig. 8a: Fine-tuned BERT, 2018 (April-June). Positive rate ranges from 55% to 71% across the production crisis. Matches VADER's directional finding far better than the default model.

Monthly proportion of Tesla tweets classified as positive by the fine-tuned BERT model in 2020

Fig. 8b: Fine-tuned BERT, 2020 (Jan-Nov). Positive rate ranges from 59% to 74%, peaking in November alongside record deliveries. Same May 2020 pandemic dip the other two models flagged.

The architectural lesson: the underlying neural network architecture in the default and fine-tuned BERT models is identical. Only the training data changed. That single change moved the positive-rate diagnosis by ~50 percentage points. For any production sentiment pipeline, domain-matched training data is not a refinement; it is the primary determinant of whether the output is credible.
Scatter plot showing the relationship between BERT sentiment score and retweet count, with positively-scored tweets receiving more retweets

Fig. 9: Sentiment score vs retweet count. More-confidently-positive tweets accumulate more retweets. All three models agree on this directional relationship between positivity and amplification.

What a corporate communications team should take from this

The numbers are interesting. What matters more is what an in-house brand-monitoring program should look like in light of them. Three things change.

Build an engagement-weighted early-warning system

Track sentiment by reach, not by tweet count. A weighted dashboard would have flagged the May 2020 controversy days before the news cycle made it a CEO-level issue. Daily volume is noise; viral content is signal.

Treat hashtag evolution as a brand-identity barometer

The 2018-to-2020 shift from #Model3 and #SpaceX to #EV and #ClimateChange was visible in the hashtag mix months before it showed up in earnings commentary. Hashtag drift is one of the fastest leading indicators of how a brand's audience is changing.

Pick the model that matches the medium

A default off-the-shelf model trained on the wrong domain will deliver confident, decisively wrong answers. Any production social-listening pipeline should be fine-tuned on tweet-native data or validated against a domain-matched benchmark before its outputs reach an executive dashboard.

Considering social listening or NLP analytics for your brand?

FutureInSites scopes social-listening and NLP pipelines for enterprise communications, IR, and brand teams. From data preprocessing through model selection and dashboarding.

Get in touch →