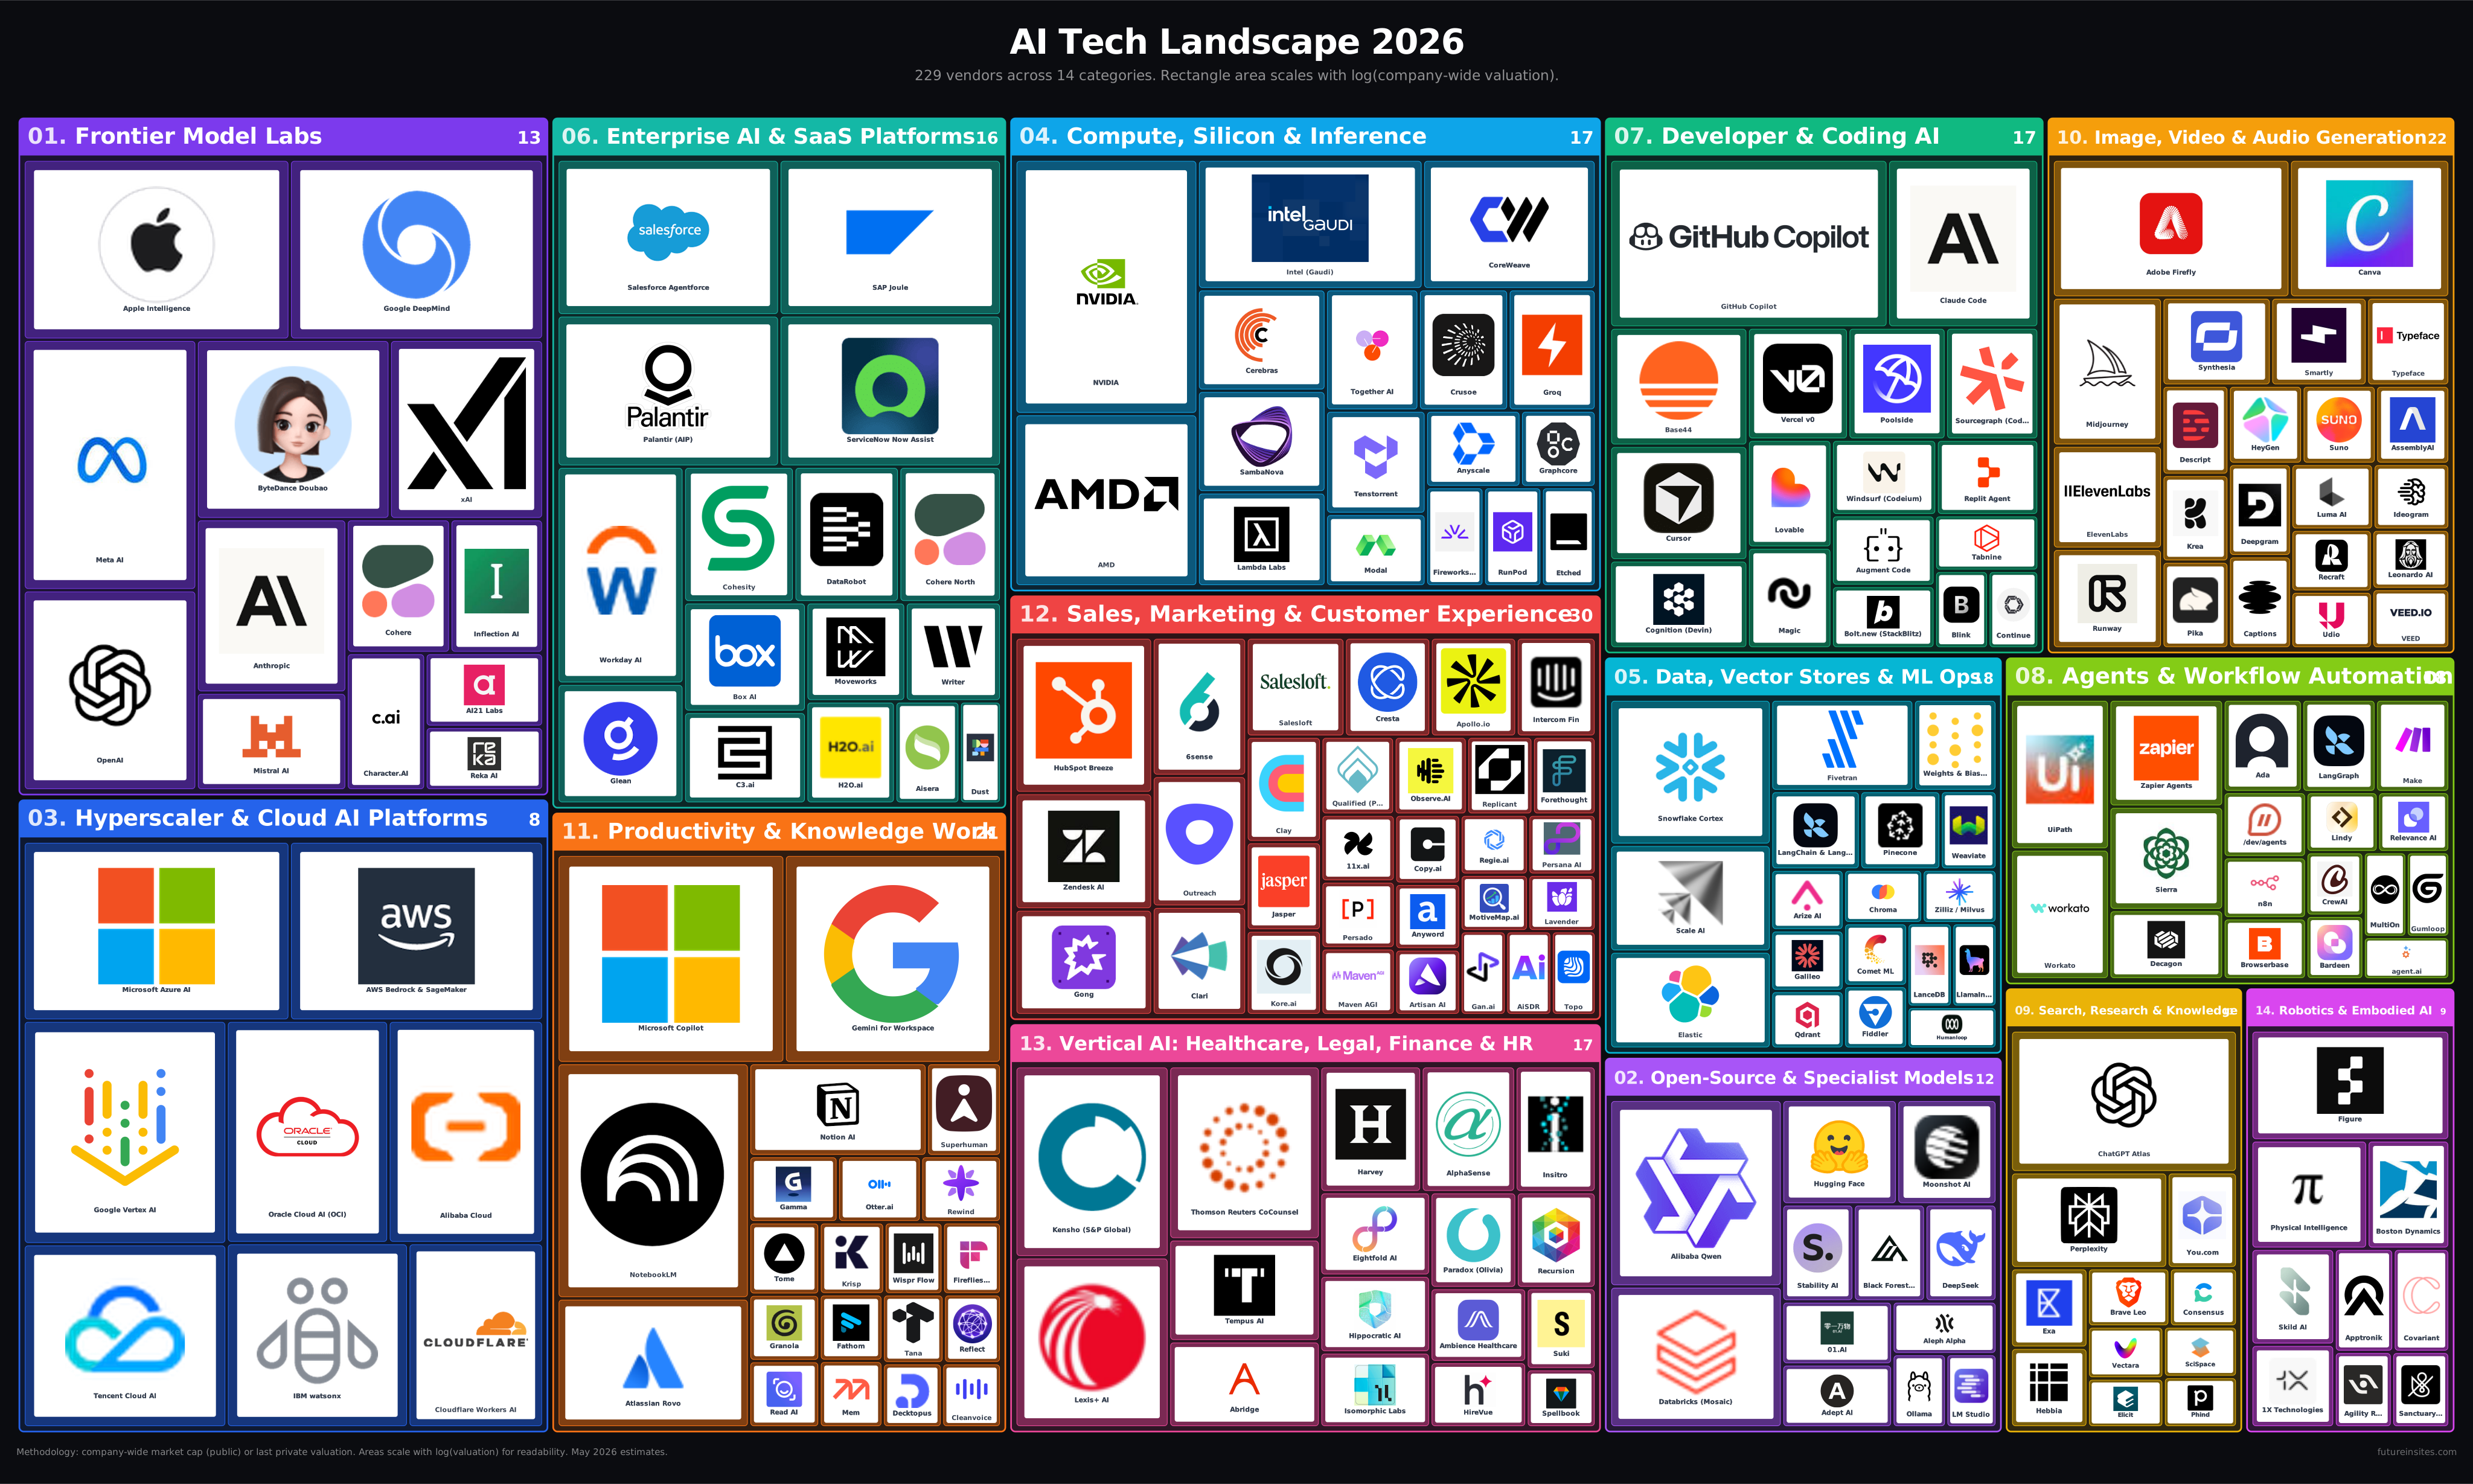
Click the chart to expand. Color-coded by category; rectangle area scales with the log of company-wide valuation.
Full Chart
275+ vendors across 14 categories, sized by company-wide valuation or market cap. Click the chart to open it full screen, or download the high-resolution PDF.
Click the chart to expand. Color-coded by category; rectangle area scales with the log of company-wide valuation.
Each of the 14 outer rectangles is a category from the AI Vendor Landscape. Categories are sized by the combined weight of the vendors inside them, so larger categories with bigger players occupy more area.
Inside each category, every vendor is sized by company-wide market capitalization (for public companies) or last reported private valuation (for private companies). To keep the chart readable across a range that spans more than four orders of magnitude, areas scale with the logarithm of valuation rather than the raw number. The relative ordering is preserved, but megacap vendors do not crush smaller players visually.
A vendor may appear in more than one category when its presence is meaningful in each. This mirrors how the underlying AI Vendor Landscape categorizes products rather than companies.
Valuations come from public market data and reported funding rounds. Estimates are directional and intended for relative comparison only. Full vendor list: AI Vendor Landscape.